The cycle time calculation formula, in its simplest form, is End Date - Start Date. This metric measures the total elapsed time from when active work begins on a task until it is completed. Understanding this core concept is the first step toward unlocking powerful insights into your team's efficiency and workflow.
What Is Cycle Time and Why Does It Matter
 Let's skip the textbook definitions and focus on what cycle time truly represents. Think of it as the 'active work' clock for any given task. It starts ticking the moment a team member begins working on an item and stops only when that work is finished. It’s a direct measure of your team’s execution speed.
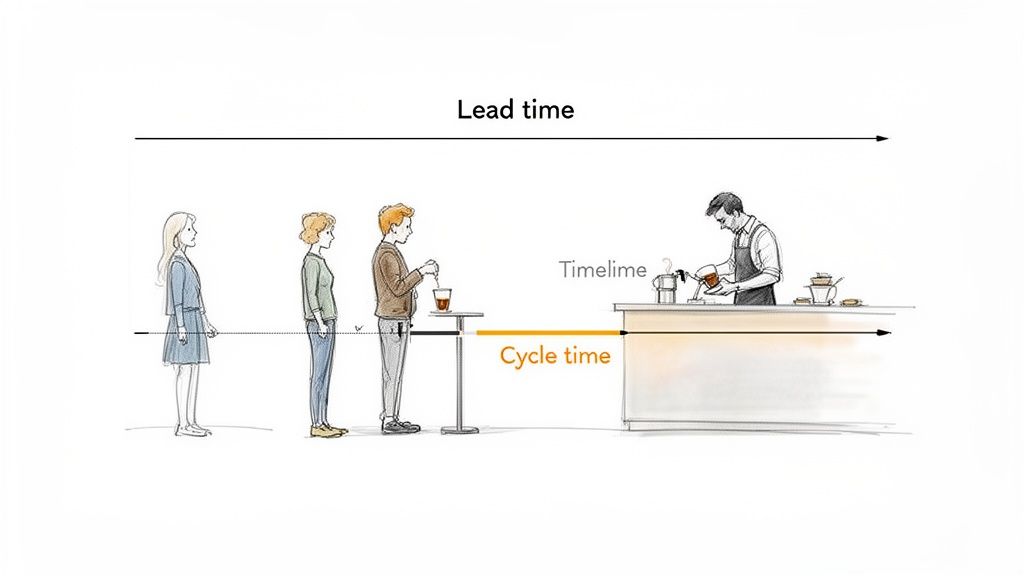
To illustrate, imagine ordering a coffee. The total time from when you join the line until you have your drink is the lead time. The cycle time, however, is only the period when the barista is actively making your specific coffee. This distinction is vital because cycle time isolates your internal process efficiency from external waiting periods.
The True Value of Tracking Cycle Time
Understanding your cycle time isn't just about collecting data; it's about turning that data into a tool for improvement. When you consistently measure how long tasks take, you gain a clear, factual basis for optimizing your workflow. You can learn more about the broader context in our guide on what is process management.
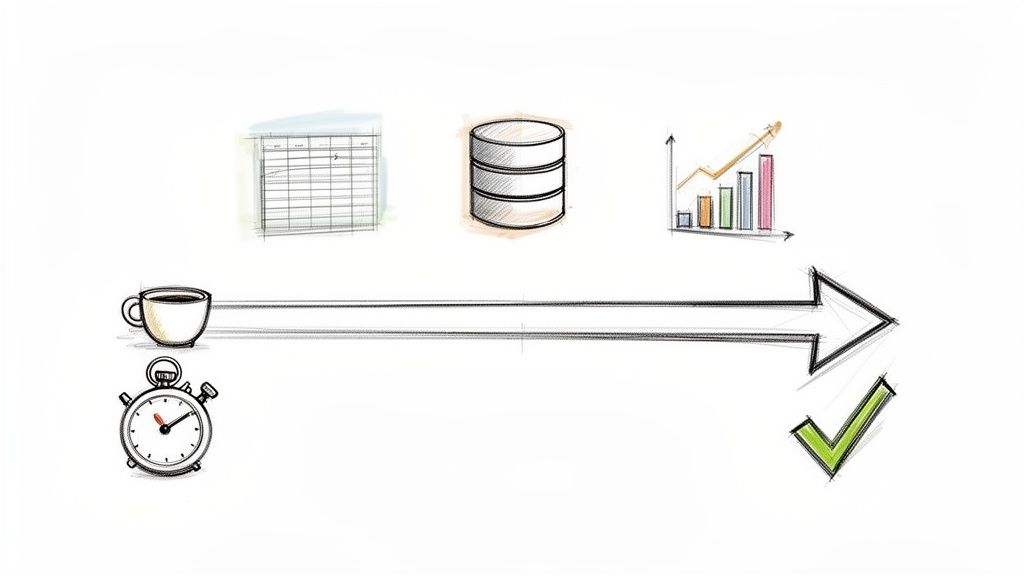
By tracking this metric, teams can achieve several key benefits:
- Pinpoint Hidden Bottlenecks: A long cycle time for a specific task type often points directly to a hidden inefficiency or roadblock in your process.
- Create Reliable Forecasts: When you know the average time it takes to complete work, you can predict future delivery dates with much greater accuracy.
- Foster Continuous Improvement: Data gives teams a common language to discuss performance, making it easier to identify and implement meaningful changes.
Ultimately, cycle time answers a simple but powerful question: "How long does it take us to get things done once we start?" Answering this question honestly is the foundation of a high-performing and predictable team.
How to Calculate Cycle Time: The Standard Formula
At its heart, the cycle time calculation formula is beautifully simple. You only need two pieces of information: a start point and an end point. That's it.
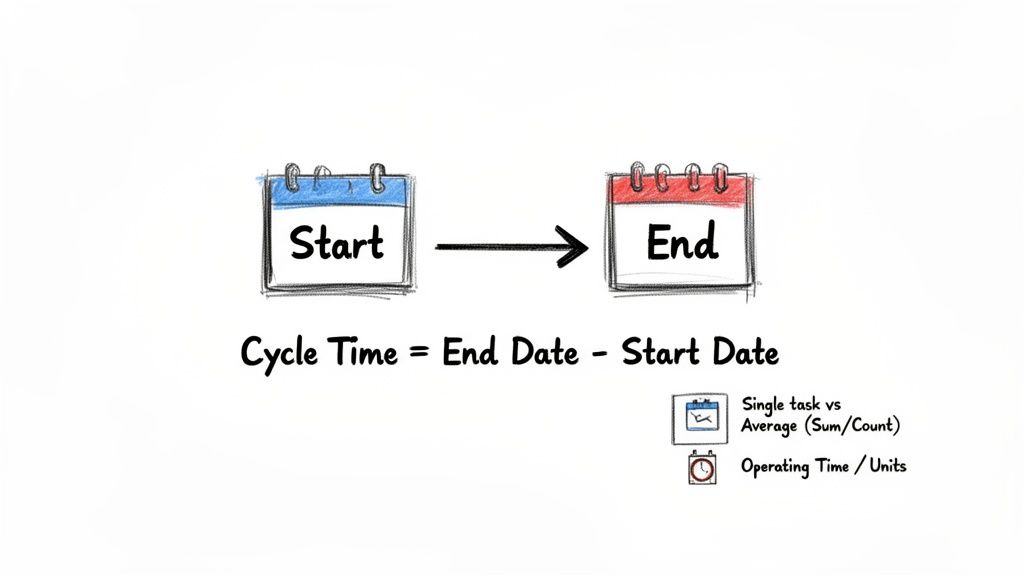
The core formula is:
Cycle Time = End Date - Start Date
This simple equation tells you the total elapsed time from the moment work actually begins on a task until it's considered done. The real key to making this work is agreeing on what "start" and "end" truly mean for your team, and then sticking to those definitions every single time.
Pinpointing Your Start and End Dates
Your Start Date isn't when a task gets created or tossed into a backlog. It's the exact moment a team member pulls that task into an "in-progress" status. Think of it as the instant someone raises their hand and says, "I'm on it."
Likewise, the End Date marks the point where the task is 100% complete and needs no more active work. For a software team, that could be when code is merged into the main branch. For a marketing team, it might be when a blog post goes live.
Consistency here is everything. If one person starts the clock when they open a ticket, but another waits until they write the first line of code, your data becomes a mess. You have to establish clear, shared definitions for these trigger points to get numbers you can actually trust.
Using the Formula in the Real World
The basic End Date - Start Date formula is perfect for individual tasks, but it's just as useful for finding an average across a whole project. Software development teams, in particular, lean on this metric to keep their agile workflows humming.
The difference it makes can be huge. High-performing dev teams often see median cycle times around 5.6 days. In contrast, teams in the bottom quartile can take as long as 21.4 days, which is a 74% difference driven by a solid grasp of their workflow data. You can dig deeper into how teams apply this by checking out the latest findings on cycle time calculations.
To help you get started, here’s a quick breakdown of the core cycle time formulas and when to use them.
Core Cycle Time Formulas at a Glance
| Formula Type | Calculation | Best For |
|---|---|---|
| Single Task | End Timestamp - Start Timestamp | Measuring the duration of one specific work item, like a bug fix or feature. |
| Average | Sum of All Cycle Times / Total Number of Tasks | Understanding the typical time it takes to complete work across a project or time period. |
You might also come across a variation from the world of manufacturing, often expressed as Operating Time / Units Produced. This version is great for high-volume, repetitive work, but for most knowledge work teams, the simple End Date - Start Date model gives you far more actionable insights into your process.
How to Calculate Cycle time, Step by Step
Alright, you've got the formula down. Now, let's get our hands dirty and actually calculate this thing. Before we dive in, there’s one non-negotiable rule: your cycle time calculation is only as good as your data. Everything hinges on capturing accurate start and end times for your work.
The good news? You don't need a fancy, expensive tool to start. You can get a solid grip on your cycle time using methods that fit right into your team's existing workflow.
We'll look at three common ways to gather the timestamps you need, starting with the simplest and working our way up.
Method 1: Manual Tracking with a Simple Log
For small teams or quick projects, don't overthink it. A simple log can be incredibly powerful. This could be a whiteboard in the office, a shared notebook, or even a basic digital document. The mission is simple: write down when work starts and when it stops.
Here’s how to pull it off in four straightforward steps:
- Define Your Process: Map out your workflow stages. You absolutely need a "To Do," an "In Progress," and a "Done" status, at a minimum.
- Create Your Log: Set up columns for Task Name, Start Time, and End Time. That's it.
- Record Start Times Diligently: The moment someone pulls a task into "In Progress," they have to log the current date and time. No exceptions.
- Capture the Finish Line: When that task is officially moved to "Done," they immediately record the final timestamp in the "End Time" column. This simple habit is the whole game.
This approach takes discipline, for sure. But it costs nothing to set up and gives you immediate, valuable feedback on your process.
Method 2: Using a Spreadsheet for Better Organization
Once you're tracking more than a handful of tasks, a spreadsheet is your best friend. Something like Google Sheets or Microsoft Excel not only makes logging the data cleaner but also does all the math for you. It's the perfect middle ground between a notebook and a full-blown project management system.
Here's the setup:
- Set Up Your Columns: Create a sheet with these headers:
Task ID,Task Description,Start Timestamp,End Timestamp, andCycle Time (Days). - Log Your Data: Just like the manual method, your team's job is to fill in the start and end timestamps as work happens.
- Apply the Formula: In the
Cycle Time (Days)column, you'll use a simple subtraction formula. For instance, if your End Timestamp is in cell D2 and Start Timestamp is in C2, the formula is just=D2-C2. Drag it down for all your tasks. - Analyze the Results: After you've logged a few tasks, you can instantly calculate the average cycle time, spot outliers, and even build charts to see how you're trending over time.
Getting your raw data into a spreadsheet is a huge first step. If you want to take it further and build out more sophisticated dashboards, check out how you can create a custom project management report in Excel to really visualize your team's performance.
Method 3: A Glimpse into Automated SQL Queries
If your team works out of a system with a proper database, like a custom-built tool, a CRM, or a serious ticketing system, you can often skip the manual entry entirely. A quick SQL query can pull the data and calculate cycle time for you automatically.
A basic query to do this might look something like this:
SELECT task_id, end_timestamp - start_timestamp AS cycle_time FROM tasks WHERE status = 'completed'; This little script finds all the completed tasks and calculates the difference between their end and start timestamps on the fly. It's the most efficient way to get precise, real-time data, but it does require someone with database access and a little bit of SQL know-how to set it up.
Cycle Time vs. Lead Time: What’s the Real Difference?
![]()
This diagram shows how you can track the timestamps needed for the cycle time formula, whether you're using a simple work log or a sophisticated automated tool. No matter how you capture the data, the core goal is the same: pinpointing the exact start and end times of active work.
In the world of project management, few terms get mixed up more often than cycle time and lead time. They sound alike and are often mentioned in the same breath, but they measure two completely different parts of your workflow. Understanding the distinction is absolutely crucial for honest reporting and making real process improvements.
Let's use a simple analogy: ordering a pizza.
Lead time is the entire experience from the customer's perspective. It begins the moment you place your order and doesn't end until the hot pizza arrives at your door. This includes the time your order waits in the queue, the time it takes to make the pizza, the baking time, and the entire delivery drive. It’s the total wait.
Cycle time, however, is just one piece of that journey. It starts only when the chef actually begins preparing your pizza, like tossing the dough, adding the sauce, and arranging the toppings. It ends the moment it comes out of the oven, ready for boxing. It measures the "hands-on" work time, completely separate from any waiting around.
Why Does This Distinction Matter So Much?
Both metrics are incredibly valuable, but they tell you completely different stories about your team's performance. Lead time is your customer-facing metric; it reflects the total time they have to wait for something. If your lead time is long, the problem might not even be with your production team, since it could be a bottleneck in the approval queue or a delay in handoffs.
Cycle time, on the other hand, isolates your team's direct efficiency. It tells you exactly how long it takes to get a task done once you start working on it, with no outside delays. A low cycle time proves your team is fast and effective, even if the overall lead time is high due to issues elsewhere in the system.
Lead time measures the customer's perception of speed. Cycle time measures your team's internal execution speed. One is an outside-in view of the whole process; the other is an inside-out view of active work.
To make this perfectly clear, let's put them side-by-side.
Cycle Time vs Lead Time Key Differences
This table offers a direct comparison to clarify the distinct purposes and insights offered by each metric.
| Metric | Starts When | Ends When | What It Measures | Primary User |
|---|---|---|---|---|
| Cycle Time | Active work begins on a task. | The task is fully completed. | The team's internal processing speed and efficiency. | Team Leads, Project Managers |
| Lead Time | A request is made by a customer. | The request is delivered to the customer. | The full customer experience and total wait time. | Product Owners, Management |
In short, knowing both gives you a complete picture. One tells you what your customer is feeling, and the other tells you how your team is performing.
How to Interpret Your Cycle Time Results
So, you've calculated your cycle time. That's the easy part. The real magic happens when you start to understand the story behind the numbers. A single average figure can be dangerously misleading; you need to dig into the distribution of your results to see the patterns, outliers, and real opportunities for improvement.
Think of it like looking at a marathon runner's race times. Their average finish time is interesting, but it doesn't tell you about the one race they ran exceptionally fast or the other where they struggled. Those outliers are often where the most valuable lessons are hiding, either a brilliant strategy to repeat or a painful bottleneck that needs fixing.
Visualizing Your Workflow with Scatter Plots
One of the most powerful tools for this is a cycle time scatter plot. This chart is simple but effective: each completed task is a dot, plotted with its cycle time on the vertical axis and its completion date on the horizontal axis.
As you add more data, a picture of your workflow emerges. You can instantly spot trends, clusters, and, most importantly, the outliers.
A task that took 30 days when your average is 5 days will stick out like a sore thumb. That single dot is a conversation starter. Was the task blocked for weeks? Did the scope creep up unexpectedly? The scatter plot turns a spreadsheet of numbers into a visual guide, showing you exactly where to focus your attention.
Moving Beyond Averages with Percentiles
Averages are simple, but they're easily thrown off by a few abnormally long or short tasks. For a much more reliable picture of your team's performance, you should look at percentiles. The 85th percentile, for example, reveals the maximum time it takes to complete 85% of your work items.
This is a game-changer for forecasting. If your 85th percentile cycle time is 8 days, you can confidently tell your stakeholders that almost any new piece of work will be finished within that window. That's a far more robust and trustworthy promise than an average, which could be skewed by a handful of quick wins.
Common Pitfalls That Skew Your Results
Of course, your interpretation is only as good as your data. A few common mistakes can easily distort your numbers and lead you to the wrong conclusions. In manufacturing, for instance, simply ignoring variability has been shown to skew results by 15-20%. You can explore these insights on LiveTecs.com to see how the right formula prevents bad data.
To keep your data clean and your insights sharp, watch out for these classic tripwires:
- Inconsistent Definitions: If one person thinks "Start Date" is when an idea is proposed and another thinks it's when coding begins, your data is flawed from the get-go. Your team needs a rock-solid, shared understanding of what starts and stops the clock.
- Forgetting Non-Working Hours: Are you counting weekends and holidays? If so, you're artificially inflating your cycle times and making your process look less efficient than it actually is.
- Ignoring Blocked Time: A task can spend days waiting on feedback or a decision from another team. If you lump that "wait time" in with "active work time," you're hiding the external dependencies that are really slowing you down.
Practical Ways to Improve Your Team's Cycle Time
Knowing your cycle time is great, but getting that number down is where the real magic happens. This is the point where you shift from just measuring to actually making a difference. Let's look at a few proven strategies that get right to the heart of what causes delays. These aren't just theories; they are practical steps you can take to make your team faster and more predictable.
One of the single most effective things you can do is to strictly limit your Work in Progress (WIP). When people are trying to do too many things at once, their focus gets scattered and a ton of time gets wasted just switching between tasks. By setting a hard WIP limit, you create a powerful incentive for the team to finish what they start before pulling in new work. This simple rule naturally drives down the cycle time for every single task.
Break Down Work and Automate Repetition
Another huge win is to break big, intimidating projects into smaller, bite-sized tasks. A huge, vaguely defined piece of work can sit in the "in progress" column for weeks, wreaking havoc on your average cycle time. When you break it down into clear, completable chunks, you not only make progress visible but you help the team deliver value faster and more frequently.
Look for anything repetitive and find a way to automate it. Every manual, repeatable task is a potential bottleneck just waiting to happen.
- Automate Testing: Get a continuous integration (CI) pipeline running to handle tests automatically. This eliminates a common manual slowdown.
- Use Scripting: Take care of deployments or report generation with simple scripts. This frees up your team's brainpower for actual problem-solving.
- Leverage Integrations: Connect your tools so they talk to each other. This gets rid of manual data entry and clumsy handoffs between systems.
Automating these things clears out the clutter and lets your team focus on the creative, high-impact work they were hired to do. Our guide on practical process improvement has even more ideas on this.
Improving cycle time isn't about working harder; it's about removing the friction in your workflow. Enhanced collaboration and clear communication are key to eliminating the time-wasting delays that happen during handoffs between team members or departments.
This idea isn't new, for it has deep roots in manufacturing, where efficiency is everything. Take lean manufacturing, for example, where the effective machine cycle time formula provides incredible precision for high-volume work. As far back as 2019, global adopters had already cut their effective cycle times by 22%. Some auto giants even saw 15% throughput gains just by refining their processes. You can learn more about how lean principles apply to cycle time on Lean.org.
Your Top Cycle Time Questions, Answered
Once you have the formula down, the real questions start popping up. It's one thing to know the math, but it's another to apply it day-in and day-out. Let's tackle some of the most common questions teams have when they start tracking cycle time in the wild.
How Often Should We Calculate Cycle Time?
You'll calculate the cycle time for every single task your team completes. That’s the raw data.
The real magic, however, happens when you step back to look at the trends. Reviewing your average cycle time weekly or at the end of a sprint is a great rhythm. This regular check-in is what turns a simple metric into a powerful tool for spotting bottlenecks before they derail your progress.
Can a Cycle Time Ever Be Zero?
In the real world? No. Cycle time is all about measuring the duration of active work, and even the quickest task takes some amount of time to complete.
If you ever see a zero pop up in your data, it's almost always a red flag. It usually means a timestamp was missed or entered incorrectly. Treat it as a signal to double-check how your team is logging their work.
A cycle time of zero isn't a sign of incredible speed; it's a sign of a broken measurement. It tells you to revisit how you define and record your start and end points.
What Is a Good Cycle Time for a Software Development Team?
This is the million-dollar question, but the answer is surprisingly simple: there's no magic number. A "good" cycle time depends entirely on your team, your product's complexity, and your specific workflow.
Instead of comparing yourselves to some imaginary industry standard, focus on your own data. A "good" cycle time is one that's stable, predictable, and consistently getting shorter over time. The goal isn't to hit an arbitrary target; it's to find your own baseline and improve from there.
Does Cycle Time Include Rework or Bug Fixes?
Yes, and it absolutely should. Cycle time is meant to capture the total time spent actively working on a task to get it to "done."
If a feature needs a bug fix or some rework before it can be shipped, that's all part of the process. Including this time gives you an honest, unvarnished look at the true effort involved. In fact, it can be a fantastic way to highlight quality issues that might be hiding upstream in your process.
Stop guessing and start seeing. WeekBlast provides the lightweight work log you need to capture the start and end times that power your cycle time calculations. Ditch the bloated trackers and get clear, automated insights into your team's workflow. Start for free at WeekBlast.


